
Confession: The first time I peeked at Google Analytics, I mistook ‘Bounce Rate’ for a neighborhood’s trampoline ranking. Spoiler: It wasn’t. If you’ve ever tried to make sense of SEO data and ended up wishing for a simpler way (or a stronger coffee), you’re not alone. Let’s take a stroll through the wild and whimsical world of SEO metrics—minus the snooze. You’ll learn what really matters, how to track it, and maybe even enjoy the ride.
When Metrics Fumble: The SEO Numbers Actually Worth Tracking
Let’s face it: tracking every SEO metric is like counting every jellybean in a jar—sure, it feels productive, but you’ll just end up with a sugar rush and a headache. In the world of SEO Metrics to Track, more isn’t always merrier. You need focus. You need purpose. And, most importantly, you need to stop obsessing over numbers that don’t actually move the needle. (Looking at you, “total page views on my About page.”)
Why Counting Every Number Is Like Senseless Calorie Math
Ever tried to count calories for every sprinkle on your donut? That’s what it’s like tracking every SEO metric under the sun. Research shows that in 2025, tracking the right SEO metrics is essential to stay competitive. If you’re spreading yourself thin across a dozen KPIs, you’re likely missing the story your data is trying to tell. Instead, focus on the metrics that actually matter—the ones that reveal performance trends and guide your next move.
Meet the ‘Core Four’ SEO Metrics to Track
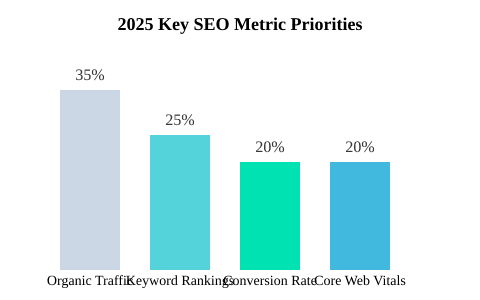
- Organic Traffic: This is your bread and butter. It tells you how many users are finding your site through unpaid search results. Forget vanity stats—Organic Traffic is the real deal, prioritized by 35% of SEO pros in 2025 reports.
- Keyword Rankings: Sure, it’s not 2012, but knowing where your target keywords stand is still crucial. It’s like checking your GPS before a road trip—except your destination is “Page One.”
- Conversion Rate: Because traffic isn’t just pretty, it needs to pay the bills. Conversion Rate links your SEO efforts directly to business results. If your visitors aren’t buying, subscribing, or filling out that form, what’s the point?
- Core Web Vitals: Google’s new favorite child. These metrics—LCP, FID, CLS—are now critical ranking factors. Ignore them, and you might as well be building your site on quicksand. Studies indicate that Core Web Vitals are critical user experience metrics that impact SEO rankings.
Unexpected Metric Tales: When Bounce Rate Saved My Landing Page (and My Pride)
Let’s talk Bounce Rate. I once had a landing page with a bounce rate so high, it could’ve qualified for the Olympic pole vault. But here’s the twist: every 1% decrease in bounce rate led to a 10% increase in sessions. Sometimes, engagement metrics like Bounce Rate are the canary in your SEO coal mine—telling you when your content needs a tweak or a total makeover. Don’t ignore the signs!
“Your SEO metrics are your GPS—stop ignoring the rerouting signs.” — Marie Haynes
Why Less Is More: The Power of Focused SEO Tracking
Tracking only the essential SEO Metrics to Track—Organic Traffic, Keyword Rankings, Conversion Rate, and Core Web Vitals—prevents overwhelm and enables actionable insights. Excess metrics just dilute your focus and hide the valuable performance trends that actually matter. So, next time you’re tempted to track “average scroll depth on Tuesdays,” remember: your time (and sanity) are better spent elsewhere.

Metrics in Action: A Table of SEO Tools, Features, and How They Stack Up
Let’s face it: tracking SEO metrics is a bit like herding caffeinated cats. You’ve got Google Analytics purring about Organic Traffic, Google Search Console whispering sweet nothings about Keyword Rankings, and then Semrush and Ahrefs crashing the party with competitive analysis and traffic cost charts that look like they belong in a Wall Street thriller. So, which SEO tools actually tell the truth? And which ones are just really good at creative storytelling?
Which Tools Tell the Truth? (Spoiler: They All Lie Sometimes)
First up, Google Analytics. This is your go-to for tracking Organic Traffic, Conversion Rate, and engagement metrics. Want to know how many people landed on your blog after searching “best cat memes 2025”? Analytics has your back. But don’t expect it to spill the beans on Keyword Rankings—that’s not its jam.
Enter Google Search Console. This tool is the Sherlock Holmes of SEO KPIs, sniffing out Keyword Rankings, Core Web Vitals, and indexed pages. It’s great for technical SEO and showing you which keywords you’re (allegedly) ranking for. But beware: its “average position” metric is about as mysterious as the Bermuda Triangle. One day you’re #3, the next you’re #47, and nobody knows why. (Seriously, if you ever crack the code, let me know.)
What Each Tool Measures Best (and Where They Fudge the Numbers)
Now, let’s talk about the cool kids: Semrush and Ahrefs. These SEO tools are like the James Bonds of competitive analysis. They’ll show you who’s linking to your competitors, estimate your traffic cost (which is not the same as actual traffic, by the way), and break down Keyword Rankings across the globe. But sometimes, their numbers are more “guesstimate” than gospel. Think of it as weather forecasting—mostly accurate, but you might still get rained on.
Here’s the kicker: Not all tools measure metrics equally. Some are great at tracking Conversion Rate, others excel at Organic Traffic, and a few just want to show off their shiny dashboards. As Lily Ray wisely said:
“Metrics are only as good as the tools interpreting them.”
So, don’t put all your SEO eggs in one analytics basket. Research shows that the best strategy is to combine tools for a full picture of your SEO KPIs. If you only track what’s easy, you’ll miss what matters.
One Tool, One Metric: My Misadventures with Search Console’s ‘Average Position’
Let’s get personal for a second. Ever tried to explain to your boss why your “average position” went from 8 to 28 overnight? Yeah, me too. Turns out, Search Console’s average position is like a moody teenager—unpredictable and prone to dramatic swings. It averages your ranking across all queries, even the ones you didn’t know you were targeting. So, if you suddenly rank #1 for “unicorn SEO strategies” (congrats!), but drop to #99 for “SEO tools,” your average position will look like it’s on a rollercoaster.

Bottom line: Google Analytics and Search Console reign for traffic and user metrics, while Semrush and Ahrefs rock at competitive analysis and Keyword Rankings. Choose your tools based on the SEO KPIs you actually need to track—unless you really enjoy wild goose chases.
Charts, Sharks, and Story Arcs: Visualizing Your SEO Performance (Without Drowning!)
Let’s be honest: nothing spikes your heart rate quite like opening your SEO analytics dashboard and seeing that traffic line chart. Is it a glorious upward arc? A terrifying nosedive? Or, worst of all, a flatline that makes your morale look like a pancake? Welcome to the wild world of SEO Analytics, where every chart tells a story—and sometimes, it’s a horror story.
‘A line chart is worth a thousand panic attacks.’ — Aleyda Solis
Pattern Pitfalls: When the Pretty Traffic Line Goes Flat
You know that moment when you expect a majestic traffic spike, but instead, your chart looks like it’s on life support? Don’t panic (yet). Sometimes, a flat line just means your content is consistent. Other times, it means your site is about as lively as a sunken ship. Engagement Metrics like Bounce Rate and Dwell Time are your canaries in the coal mine. If users are bouncing faster than you can say “404 error,” it’s a sign your content isn’t matching their intent—or maybe your page loads slower than a dial-up modem in 1998.
User Engagement Metrics—How to Read Them Before Your Boss Does
Let’s break it down: Bounce Rate tells you how many visitors take one look and run for the hills. Dwell Time is how long they stick around, hopefully long enough to read more than your meta description. Research shows that every 5% drop in bounce rate can boost your conversion rate by a whopping 16%. And if your top-performing pages have an average dwell time of over 1:30 minutes, you’re doing something right (or your visitors got distracted by a cat video and forgot to leave).
| Metric | Target/Insight |
|---|---|
| Bounce Rate | Each 5% drop = 16% lift in conversion rate |
| Core Web Vitals | LCP <2.5s, FID <100ms, CLS <0.1 (2025 recommendations) |
| Dwell Time | Top-performing pages >1:30 min average |
From Data to Action: A Quick Checklist for SEO Improvement
- Tweak Content: If bounce rates are high, revisit your headlines, intros, and calls-to-action. Make sure you’re answering the questions your users are actually asking (not just what you wish they were).
- Speed Up Your Site: Core Web Vitals are now the cool kids in town. Google wants your Largest Contentful Paint (LCP) under 2.5 seconds, First Input Delay (FID) under 100ms, and Cumulative Layout Shift (CLS) under 0.1. If your site loads slower than a snail on vacation, it’s time for a tune-up.
- Spice Up UX: User Experience Metrics aren’t just buzzwords. Make navigation intuitive, visuals engaging, and CTAs impossible to miss. Remember, if your site feels like a labyrinth, users will bail faster than you can say “exit intent.”
So, next time you’re staring at your performance dashboards, remember: Engagement Metrics and Core Web Vitals are your trusty life jackets. They turn overwhelming numbers into actionable steps—no swimming lessons required.

Tabletop Tactics: DIY SEO Scoreboard for 2025 (Just Add Coffee & Honesty)
Let’s be honest: tracking SEO Performance Metrics can feel like herding caffeinated cats. But what if you could turn the chaos into a game—complete with a DIY SEO Scoreboard, a mug of coffee, and maybe a doodle of a triumphant stick figure? Welcome to the future of SEO Tracking, where you don’t need a PhD in spreadsheets—just a willingness to face your numbers (and your KPIs) head-on.
First things first: you need a table. Not the kind you eat dinner at (unless you’re multitasking), but a simple, monthly SEO performance checklist that you’ll actually use. This isn’t about building the next NASA control panel. It’s about clarity. Research shows that effective SEO tracking demands a manageable set of KPIs, recorded regularly, to highlight improvements and action points. So, let’s keep it simple, honest, and—dare I say—fun.
Your DIY SEO Scoreboard should have a few key columns: Metric, Target, Actual, Month-on-Month Change, Notes, and Action. And yes, leave a little space for motivational doodles or a “You Got This!” emoji. Here’s what a basic table might look like:
| Metric | Target | Actual | Month-on-Month Change | Notes | Action |
|---|---|---|---|---|---|
| Conversion Rate | +5% | +3% | +1% | Almost there—celebrate with coffee | Test new CTA |
| Organic Traffic | +10% | +12% | +4% | Crushed it! 🚀 | Double down on top content |
| Bounce Rate | -5% | -2% | -1% | Needs work | Improve intro paragraphs |
Here’s the secret sauce: set realistic targets. Don’t let your SEO KPIs become wishful thinking scribbled in the margins. Track your Conversion Rate, Organic Traffic, and Bounce Rate each month. If you’re feeling wild, throw in Core Web Vitals or user engagement metrics. The point is to spot long-term trends, not just one-off wins or losses.
Now, let’s talk honesty. Recording action items in your SEO Scoreboard is like leaving yourself Post-it notes from the past. It prevents the classic “we should look at this next month” trap. Trust me, I once tracked everything in my planner for a month—metrics, targets, even how many cups of coffee I drank. Not only did I finally find my lost conversions, but I also discovered that my bounce rate was directly proportional to my caffeine intake. Coincidence? Maybe. But the data doesn’t lie.
‘What gets measured gets improved…eventually.’ — Avinash Kaushik
So, grab your favorite pen, fire up your spreadsheet (or your bullet journal, if you’re feeling analog), and start tracking what counts. DIY monthly SEO tracking tables help demystify what’s really moving the needle and keep your team honest. And if you want to use highlighters and emojis, go for it—your SEO Scoreboard, your rules. Just remember: the only bad metric is the one you never measure.
TL;DR: Don’t track every stat—just the SEO metrics that move your rankings and conversions. Core Web Vitals, organic traffic, conversion rate, and user experience are your new best friends. Bonus tip: A sense of humor won’t boost SEO, but it might keep you sane.